
Ready to use Project Portfolio S Curve template in excel format for up to 36 projects.
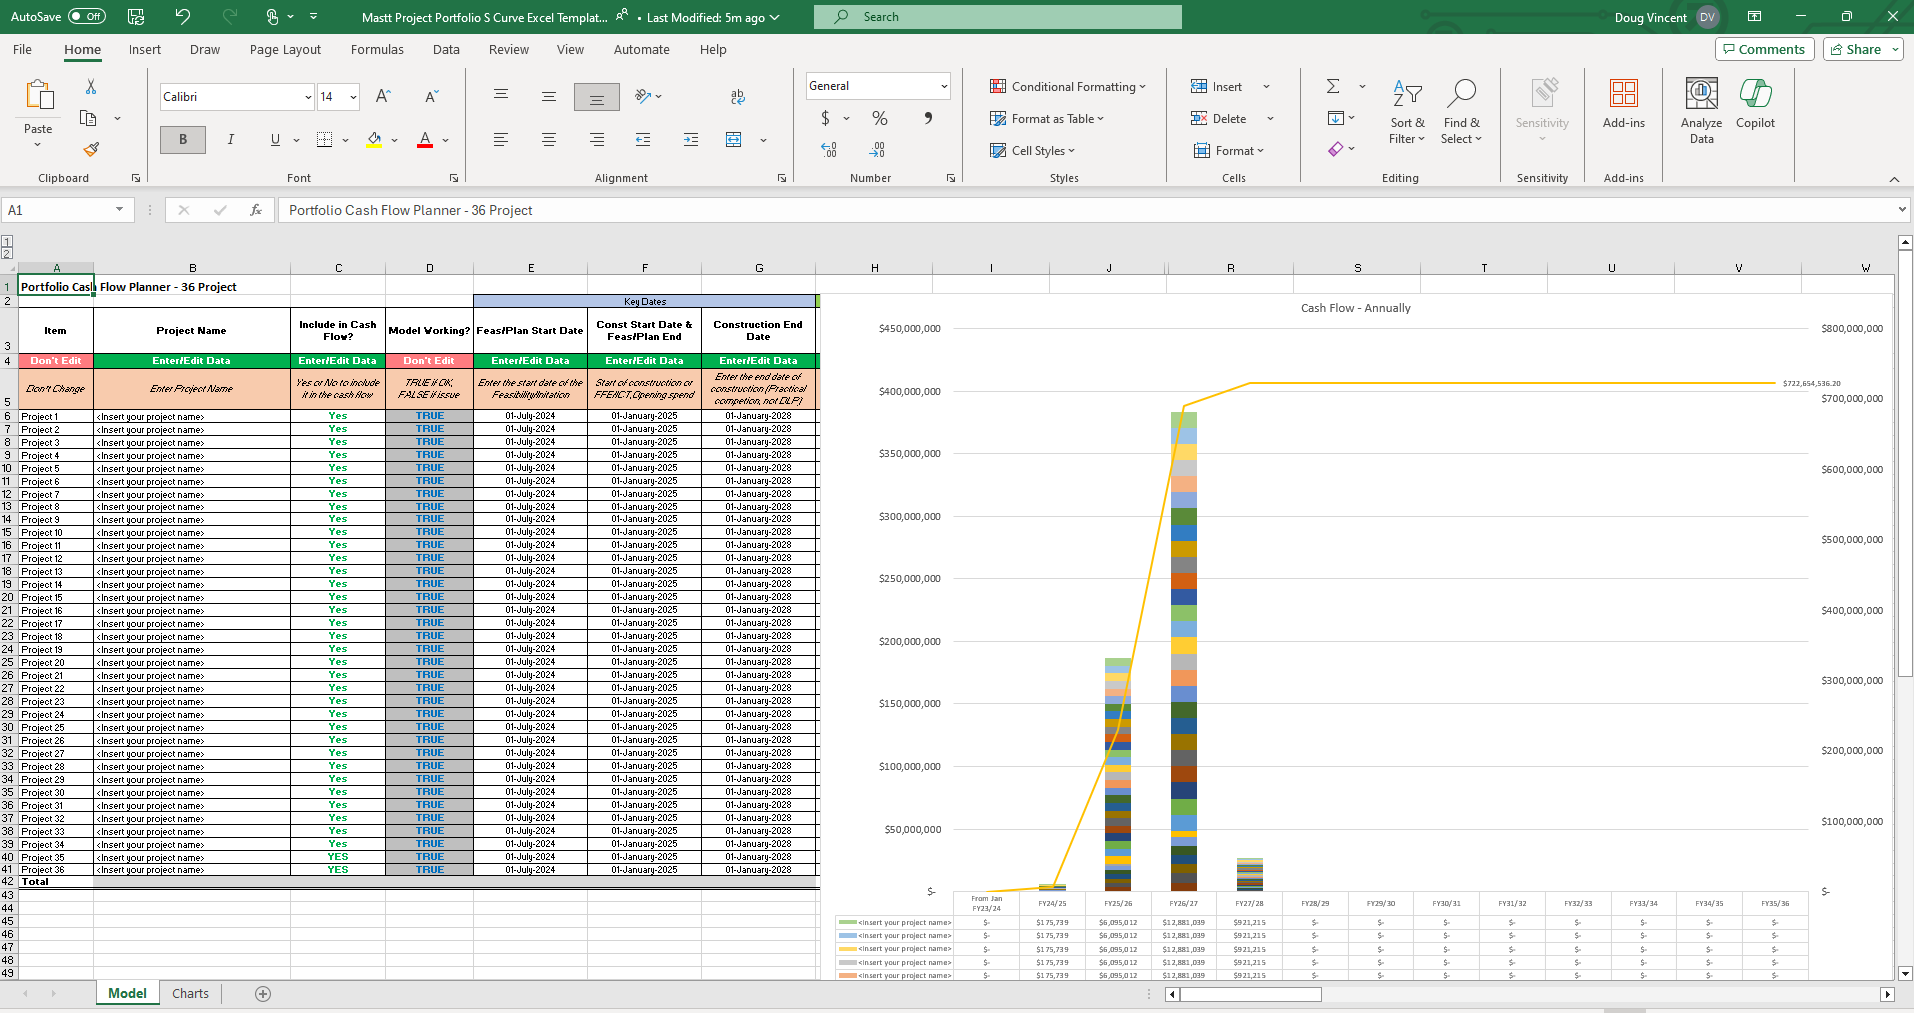
The Project Portfolio S Curve is a vital Capital Project Portfolio management tool that graphically represents cash flow for up to 36 projects over time to monitor performance, budget, and resource allocation. It is essential for communicating with Capital Project Portfolio stakeholders, such as general contractors, client-side project managers, project consultants, and project sponsors, offering a visual insight into the pace and trajectory of project spend, milestones and financial health.
Rather than you having to learn advanced spreadsheet formulas or logistic and cumulative distribution functions, use this template we've creatd for an s curve formula in excel free.
✔ Developed by leveraging industry standard logistic and cumulative distribution functions to provide an accurate and reliable tool for a project s curve graph.
✔ Up to 36 Projects can be modelled to create a 10 Year Capital Project Portfolio plan
✔ Comes pre-configured with dynamic charts and formulas, ready to use with minimal setup for immediate insight into your project's status.
✔ Editable Excel format for flexibility and customization.
✔ 1 x Microsoft Excel Template for up to 36 Projects
👉 Head to Mastt's Reporting Module

Free Best Practice Project Report Template. Ready to use Microsoft Word format.

A simple and coherent plan to help you easily identify and deal with potential risks to your business

Ready to use professional Dashboards Pack in PowerPoint format, including Board Report, Complex Dashboard, Portrait Dashboard and Simple Dashboard.
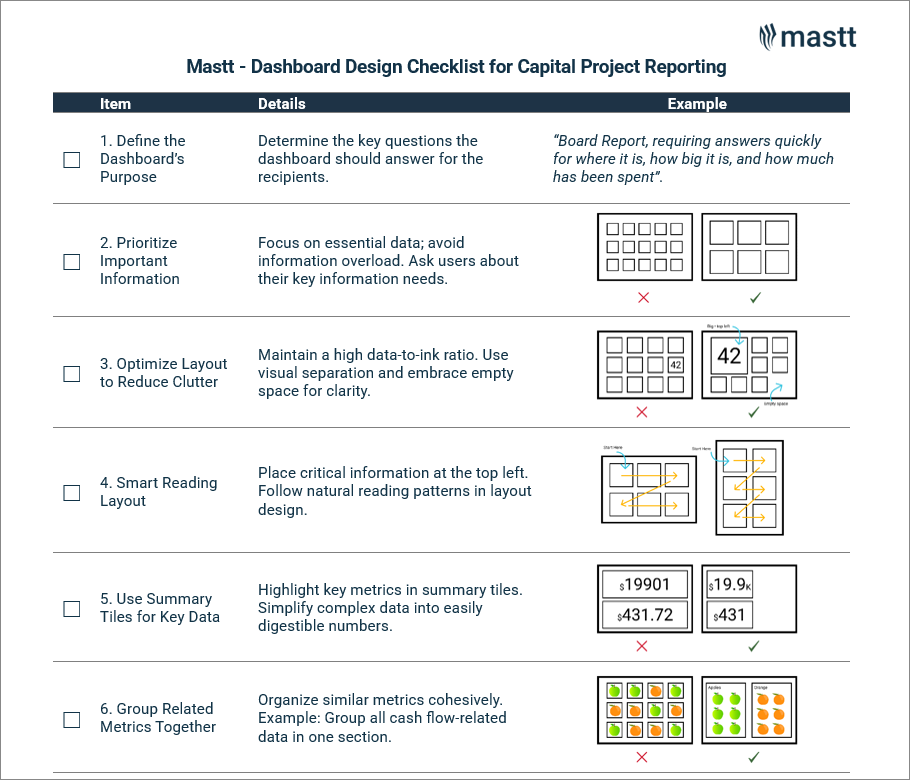
This 10 Point checklist will help you design an effective capital project, capital program, board or reporting dashboard. Great for client side project managers!
